Pushwoosh Statistics allow you to keep an eye on your app performance and messaging metrics that matter the most. Evaluate and report on your progress by checking these essential KPIs and interim results.
As a Pushwoosh user, you have access to several ready-to-use reports.
Project Overview provides a visual summary of your app growth and messaging performance.
Dashboards display the key metrics in dynamics and allow you to gain deeper insights into:
🔊Specific channel performance (Push notifications, Emails, and In-apps Dashboards);
🎯Conversions into target actions (the Events Dashboard);
🚀Overall app success (the Application Dashboard).
In addition, you can create custom Dashboards to serve your analytics needs.

Audience statistics
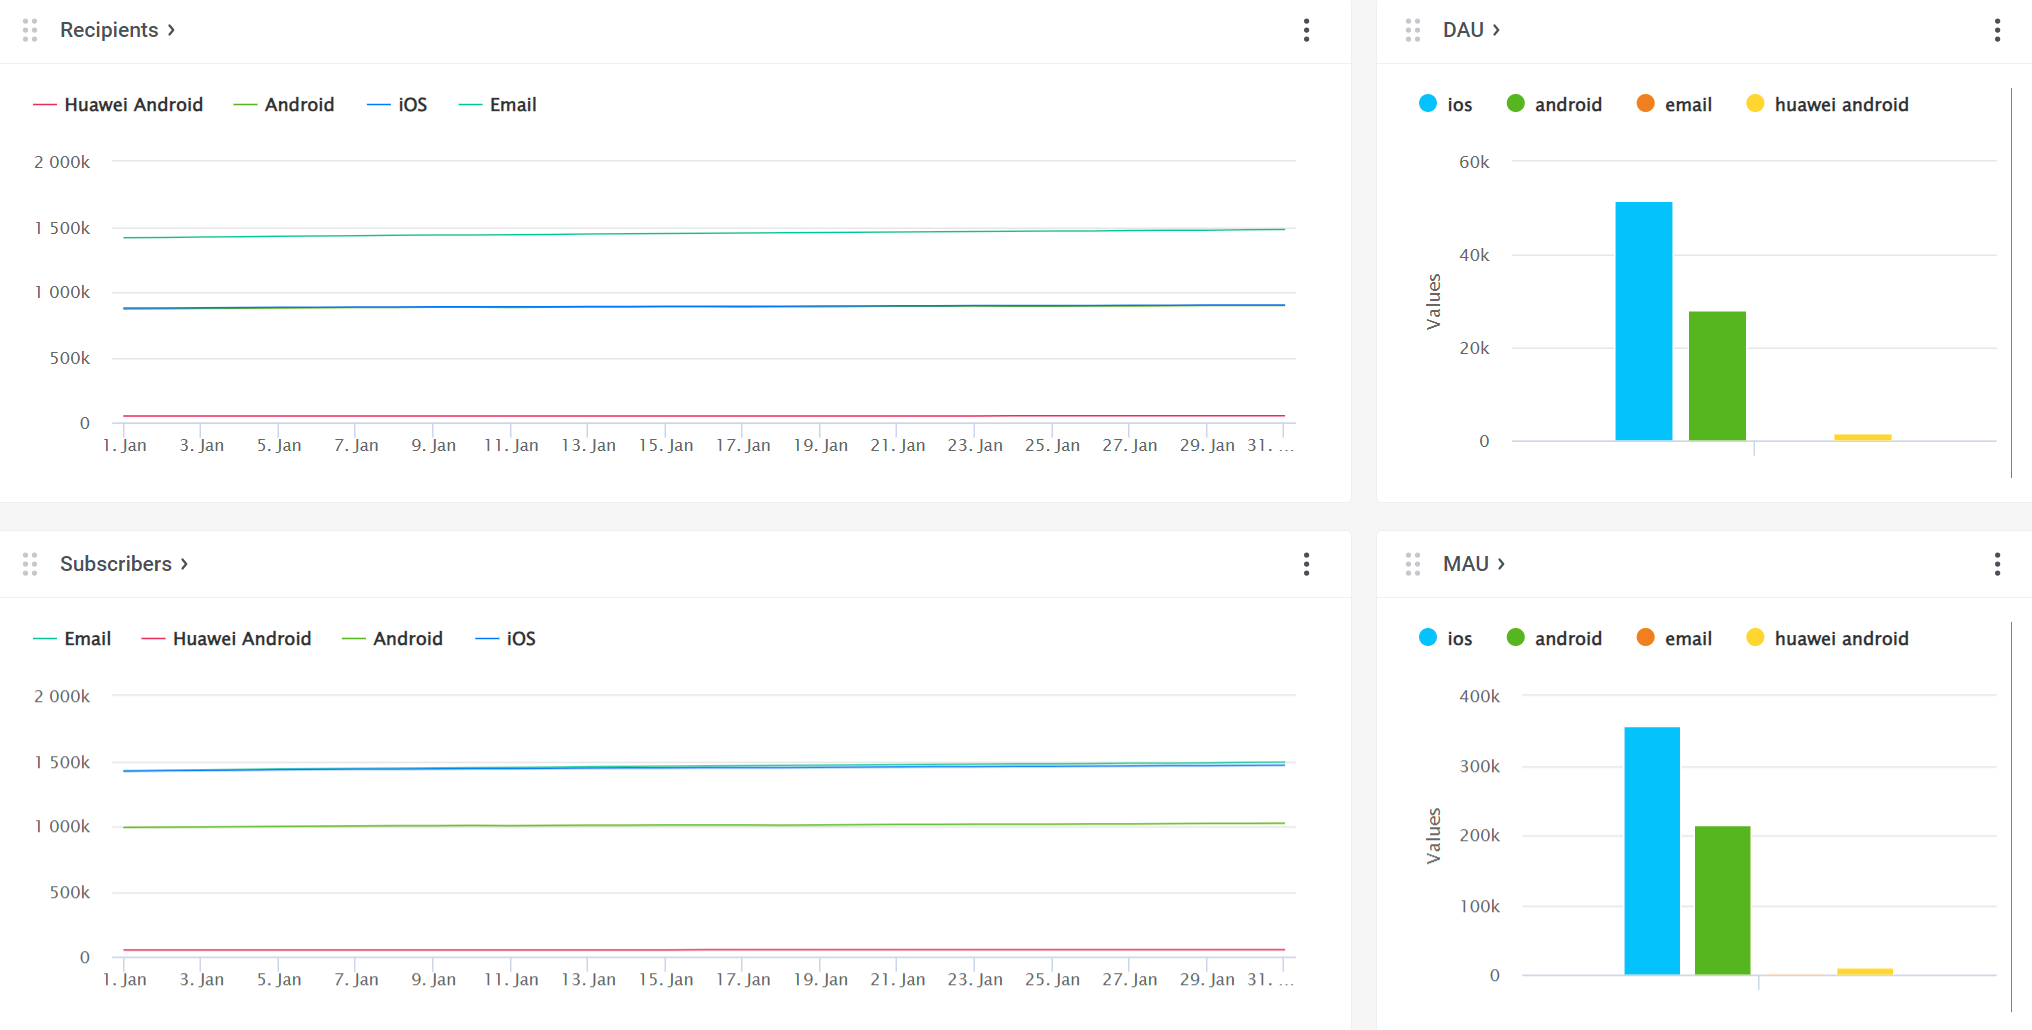
Recipients
Devices that enabled push notifications or emails from your particular app or website. This is the audience that actually receives your communications, since they expressed their consent in the form of a push notification opt-in or an email subscription.
To boost the number of recipients, you can to encourage opts-in and subscriptions, via in-app messages explaining the core values and benefits that your communications can deliver.
Subscribers
This metrics shows devices with push tokens or emails provided, reflecting the audience that is technically reachable via push notifications, emails, or in-app messages.
DAU
Daily Active Users — the number of devices on which the app is launched per day (total for all platforms).
You know how many app downloads you’ve had, but how many of those who’ve installed it, actually use it? The Daily Active Users will give you the answer. Because it refers to the number of devices, not to the number of sessions, each person is counted just one time, and it doesn't matter if they launch your app once a day or ten times a day.
MAU
Monthly Active Users — the number of devices on which the app is launched per month (total for app platforms).
Just like DAU, monthly active users tells you the unique number of people who used your app. However, it tells you about those who launched your app in the last 30 days.
User growth & engagement metrics
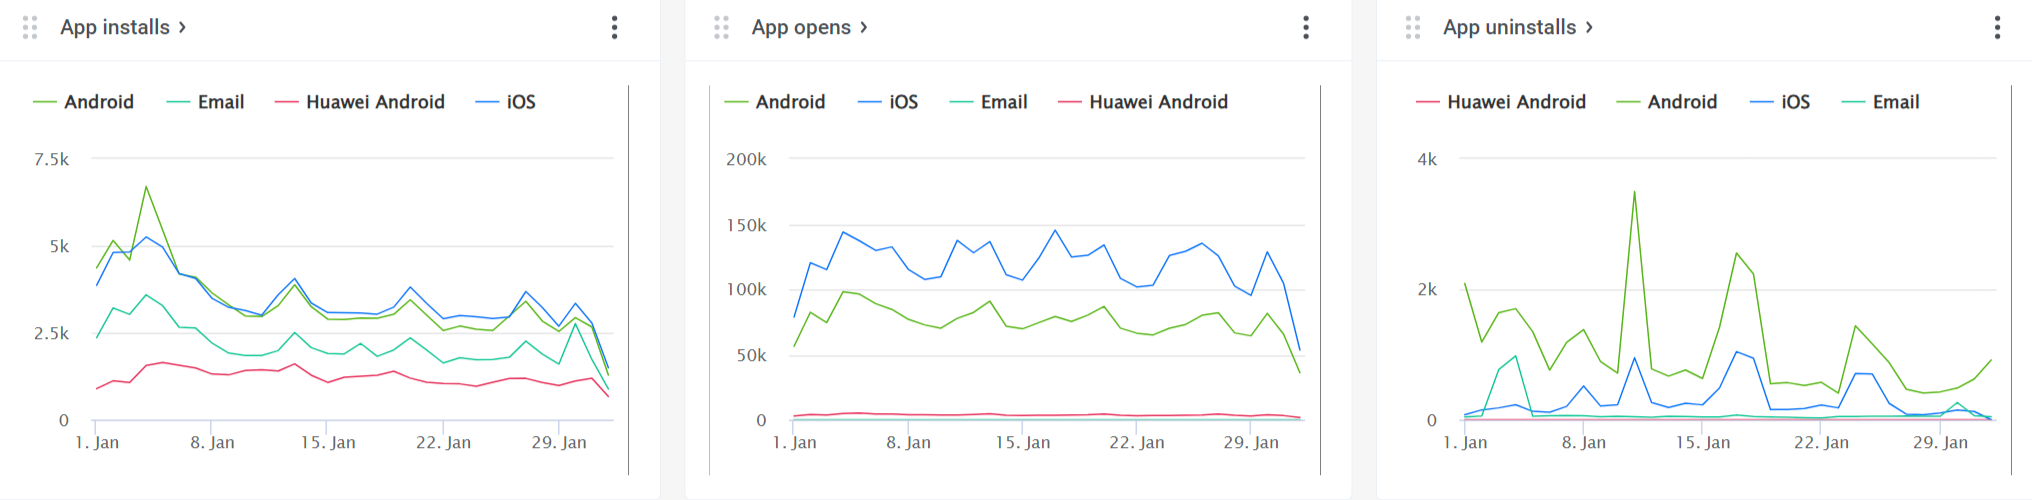
App installs
The number of new Total Devices, i.e., the number of devices registered for the app with a HWID (whether they have push tokens or not).
This metric shows you how effective your user acquisition efforts were in a specific period. To maximize your gains from a new cohort of users, we high
App Opens
The number of times the app has been launched on users’ devices as of the date and time specified.
Similar to DAU, but refers to the number of sessions, so each person is counted as many times as they launch your app. High number of app opens means users enjoy your app! Great job!
App Uninstalls
The number of devices for which push tokens were removed from the database because they were invalid or non-existent.
Messaging performance metrics
Pushwoosh Statistics can also inform you of your communication success at three levels:
1️⃣ Individual message
2️⃣ Channel overview
3️⃣ Omnichannel campaign performance
Monitor your app performance with Pushwoosh
With Pushwoosh Statistics, it's easy measure the success of your app and marketing communications. All the essential data is at your disposal, 24/7.
See how easy it is to read your app performance metrics with our reports. Sign up now for free and get access to the entire Pushwoosh platform:
